Junior

TechnoSales

Students plan a bake sale by organizing, graphing, and calculating data using Excel or Google Sheets lessons.

(1 Review)

$49.00 / year

Choose License Type: Contact us for district and school pricing.

Price information is unavailable.

To learn more about TechnoKids Computer Curriculum please contact us.

contact us

Description

Excel Lessons for Beginners

TechnoSales’ Excel lessons for beginners teach practical spreadsheet skills to ages 8-11 in a meaningful, real-world context. In this course, students plan a bake sale to raise money. This task requires them to investigate food preferences and analyze financial data to make decisions about the fundraiser. Findings are then organized into a report with graphs, showcasing the decisions that will contributes to the success of the bake sale.

Spreadsheet Course Tailored for Grades 3-6

Lessons gradually introduce essential skills such as how to manage sheets, format cells, calculate data, and graph cell ranges (column, pie, and line graph). Extension activities are designed to further develop advanced graphing skills and deepen understanding of formulas.

Problem Solving Made Fun

Specifically crafted for elementary and middle school schools, lessons introduce data analysis techniques and problem solving strategies using fun activities for either Excel or Google Sheets.

Authentic Task

The bake sale scenario provides students with a chance to investigate practical solutions to a realistic problem. Students actively participate in raising funds for a school event or equipment. The learning experience in TechnoSales presents a meaningful opportunity to learn about money.

Ready-to-Go Lessons

TechnoSales’ Excel lessons for beginners include a Teacher Guide with easy-to-follow instructions. A report template supports learners. Assessment tools include a marking sheet, quizzes, and a skill checklist. Discover how to teach spreadsheets to students with a unique and engaging project that is relevant to students.


Additional information

Ages

9, 10, 11, 12, 13

Grades

grade 4, grade 5, grade 6, grade 7, grade 8

Program

Excel, Sheets, Docs, Word

Tech Integration

language arts, math

Tech Skill

data analysis, spreadsheet, word processing

License

Starter, Class, Classrooms

Starter License Includes

online teacher guide, online student workbook, get started, printable assessment tools, sample files, templates, extension activities, certificates, parent letters

Class License Includes

online teacher guide, getting started tips, course calendar, online student workbook, online assignments, printable assessment tools, online quizzes, student reporting, sample files, extension activities, certificates, parent letters, templates

Classroom License Includes

online teacher guide, getting started tips, course calendar, class management tools, online student workbook, online assignments, printable assessment tools, online quizzes, student reporting, sample files, extension activities, certificates, parent letters, templates

Product Type

Course

The TechnoSales course has 20 assignments divided into six sessions.

Session 1: Introduction to Excel

Students are introduced to Microsoft Excel and spreadsheet terminology. To learn about the program, students play "You Found my X-Cell". This game has students identify cell references, navigate in a worksheet, enter data, fill cells with color, format the appearance of text, change the alignment, apply borderlines, and select multiple cells. It is a fun way to learn essential spreadsheet skills.

Session 2: What Desserts Do Students Prefer?

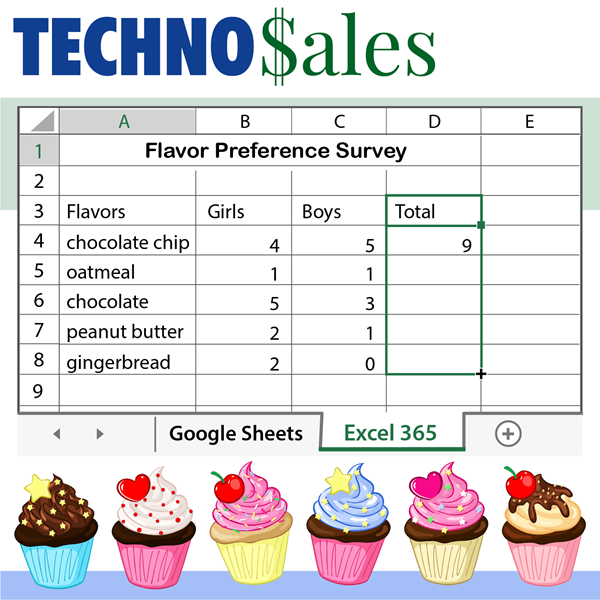
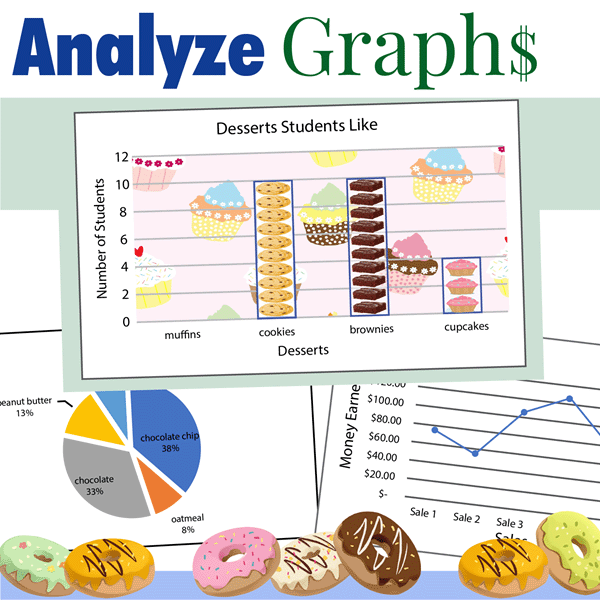
Students learn how to use Microsoft Excel to make decisions about their upcoming bake sale. To make this fundraiser a success it is essential that the dessert sold is a popular item. To answer the question "What desserts do students prefer?" students conduct a survey. The results are organized into a worksheet and then placed into a column graph. The data is then analyzed to determine the dessert item that students prefer. Will it be cupcakes, muffins, or cookies?

Session 3: Are There Differences Between Desserts Boys and Girls Prefer?

Students continue to analyze the results of the Dessert Preference Survey. To answer the question, "Are there differences between desserts girls and boys prefer?" a double column graph is used to compare the types of desserts both like to eat. This graph will help students to select a bake sale item that everyone will enjoy. By studying the graph, they will be able to make a decision that will ensure success.

Session 4: What Dessert Flavors Do Students Like?

Students must decide the flavors of dessert to have at the bake sale. This information is important because there need to be plenty of items that people like. To answer the question, "What Flavor of Dessert do Students Like?" they conduct another survey. The results are organized into a worksheet and then placed into a pie graph. The data is then analyzed to determine the flavor students should sell. Will it be chocolate, vanilla, or strawberry?

Session 5: How Many Dessert Items Do You Need?

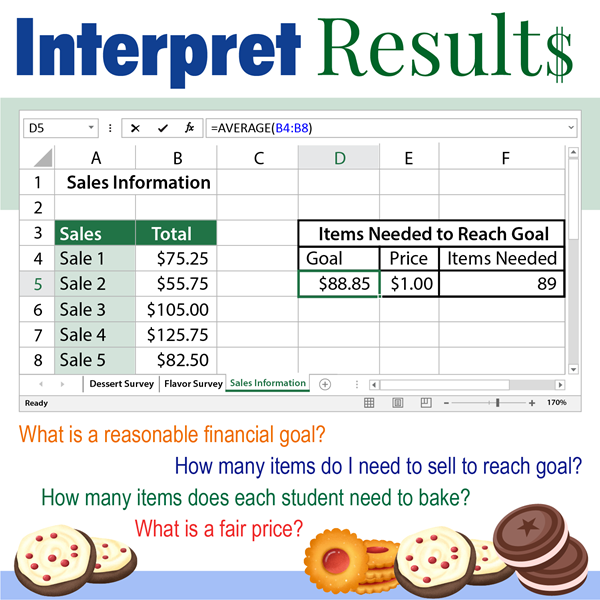
Students calculate the number of desserts required for the sale. This information is important because there must be enough items to sell to raise a certain amount of money. To answer the question, "How many Dessert Items do you Need?" past sales are studied. The sales information is organized into a worksheet and placed into a line graph. The data is then analyzed to estimate the average money earned in previous sales. This information is used to set a financial goal. Afterwards, formulas are created to calculate a fair price, amount of baked goods needed, and the number of items each student needs to bake. By using math to collect information, students can make good decisions that are sure to make the bake sale a success!

Session 6: Bake Sale Report

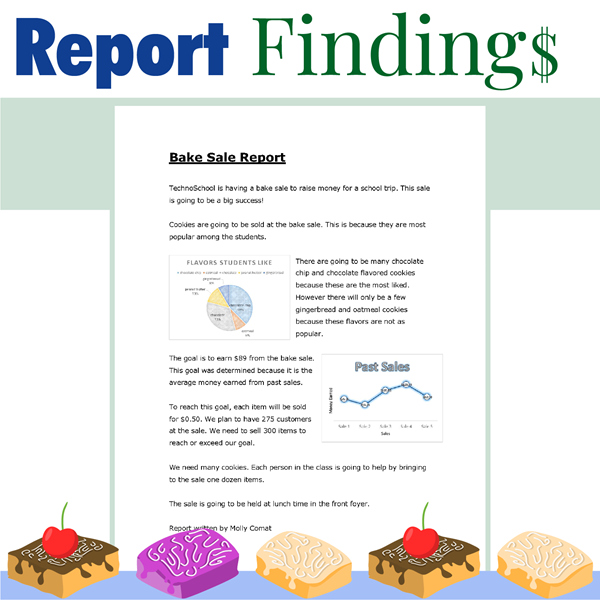
Students produce a report about how to make the bake sale a success. Using Microsoft Word, they explain their decisions about the sale. They describe the purpose of the sale, the item to be sold, financial goal, price of each item, total number of baked goods needed, and the amount each student in the class will need to bring to the sale. Afterwards, the report is edited to correct spelling and grammar errors. Upon completion, it is sent to the printer for publication.

Optional Data Analysis and Spreadsheet Lesson Plans

  • Paint a Spreadsheet Picture: Fill cells with color to create a picture.
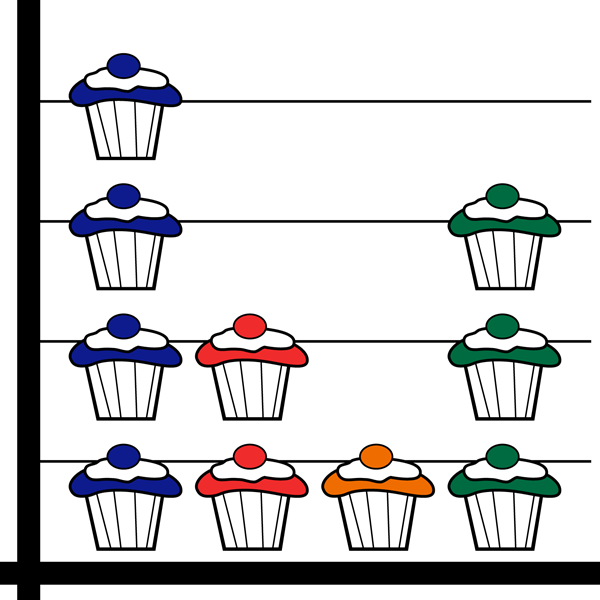
  • Add Pictures into a Bar Graph: Transform each data point into a picture.
  • Change the Chart Type: Explore ways to visually present the data.
  • Formatting Tips for Pie Graphs: Sort data and explode a pie.
  • Different Formulas, Same Result: Calculate values in cells
  • About the Sale: Reflect on the results of the sale.
Formulate a Plan for a Bake Sale Using Excel or Google Sheets

The lessons in TechnoSales are based on a problem-solving model, with each session targeting a series of questions or problems to solve. The activities connect mathematics to a real-world situation that is simplified to make it understandable to children. This project can be used to develop critical thinking, teach inquiry and analytic research methods, and build problem solving strategies. Spark student interest in STEM with fun Excel and Google lessons!
  • Relate mathematics to real-world situations
  • Develop problem-solving strategies
  • Use technology to conduct investigations
  • Organize survey data in a worksheet
  • Analyze the results of a survey
  • Format content in a spreadsheet
  • Predict outcomes and compare to actual results
  • Graph data and analyze the information
  • Calculate data using formulas to set goals
  • Produce a report to suggest a solution to a problem

TechnoSales | Excel Lessons for Beginners, Google Sheets Unit

Download

Students plan a bake sale by organizing, graphing, and calculating data using Excel or Google Sheets lessons.

1 review for TechnoSales

  1. new.technokids.com

    You guys are the best! My students that used your lessons 5 years ago still talk about them and how much more computer literate they are than their fellow college students because of them. Keep up the good work!
    The Children's Haven School,Austin
    September 28,2021
Add a review

Your email address will not be published. Required fields are marked *

Our Ed Tech Blog for Teachers

View All

FAQ

Have questions? We’re here to help.

View All FAQ

How long does it take to teach a course?

Every course includes a schedule. It lists the time recommended for each assignment. Typically, it takes between 30-60 minutes to complete an assignment depending on the grade level. Based on this time frame, a typical course takes between 360-600 minutes to complete. This is about 6-8 weeks if your students have computer class twice a week. However, if your students have computer class every day, a course can be completed in about 2-3 weeks.

How do I decide which assignments to teach?

You may not have the time to teach an entire TechnoKids course. The good news is that TechnoKids offers flexibility. Many courses can be shortened by omitting assignments or lengthened by including skill reviews and extension activities. You can easily adapt the course to suit your schedule. Refer to the Ideas for Implementation section in the teacher guide for suggestions.

Does the course integrate into other subjects?

TechnoKids courses are inter-disciplinary. This means the lesson plans blend computing skills with general content areas such as language arts, geography, or business studies. If you do not have a dedicated digital literacy class, refer to the Technology Integration Suggestions section in each teacher guide for ideas on how you can include the course in other subject areas.

Is the course a subscription?

Yes. When you purchase a course, you have access to the instructional materials for 12 months. After that time, should you want to continue, you will need to renew the subscription.

Is the course online?

Yes. You must sign into TechnoHub to access the course content from your bookshelf. The teacher guide and student workbook for a course are available online only. However, resources such as assessment tools, handouts, course slides, templates, and samples are downloadable.